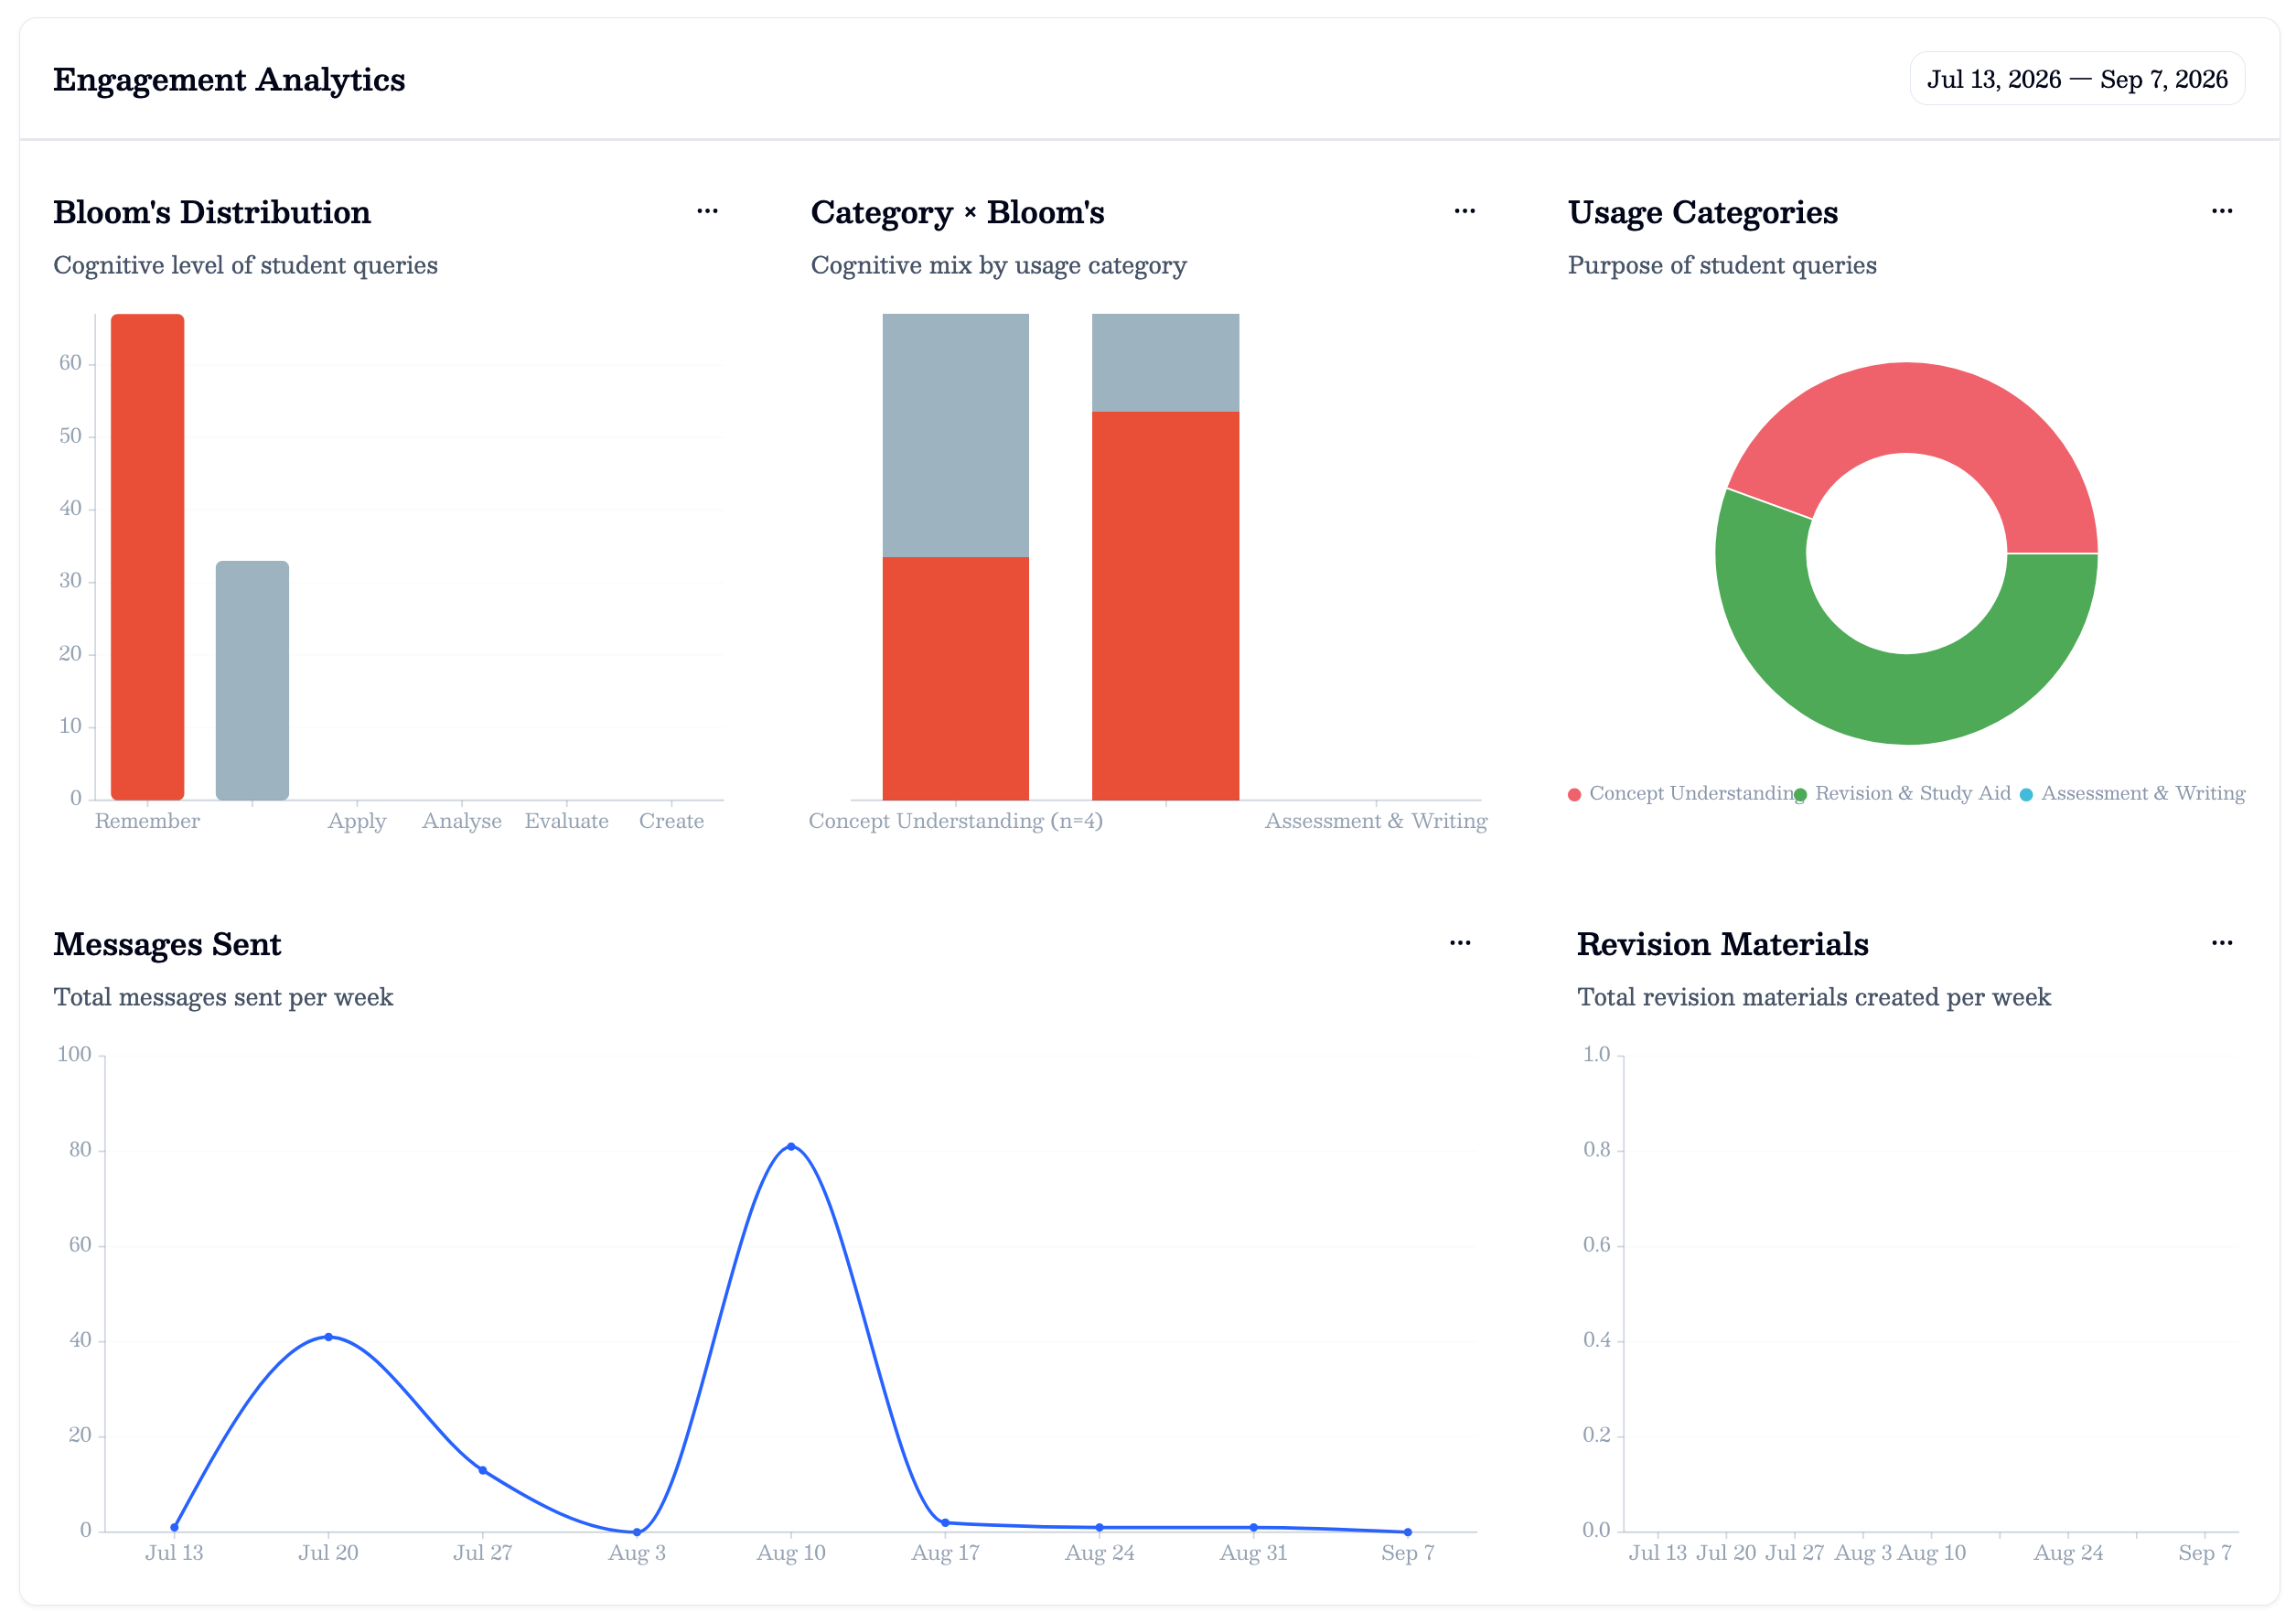
Plato gives staff visibility into engagement and common areas of confusion alongside student support. This makes it easier to see how students are using the platform and where further guidance may be useful.
What analytics can show
Analytics can help with:
- identifying commonly asked questions and topics
- spotting areas where students are struggling
- understanding engagement with the platform and revision resources
- supporting earlier intervention and teaching adjustments
Finding your module
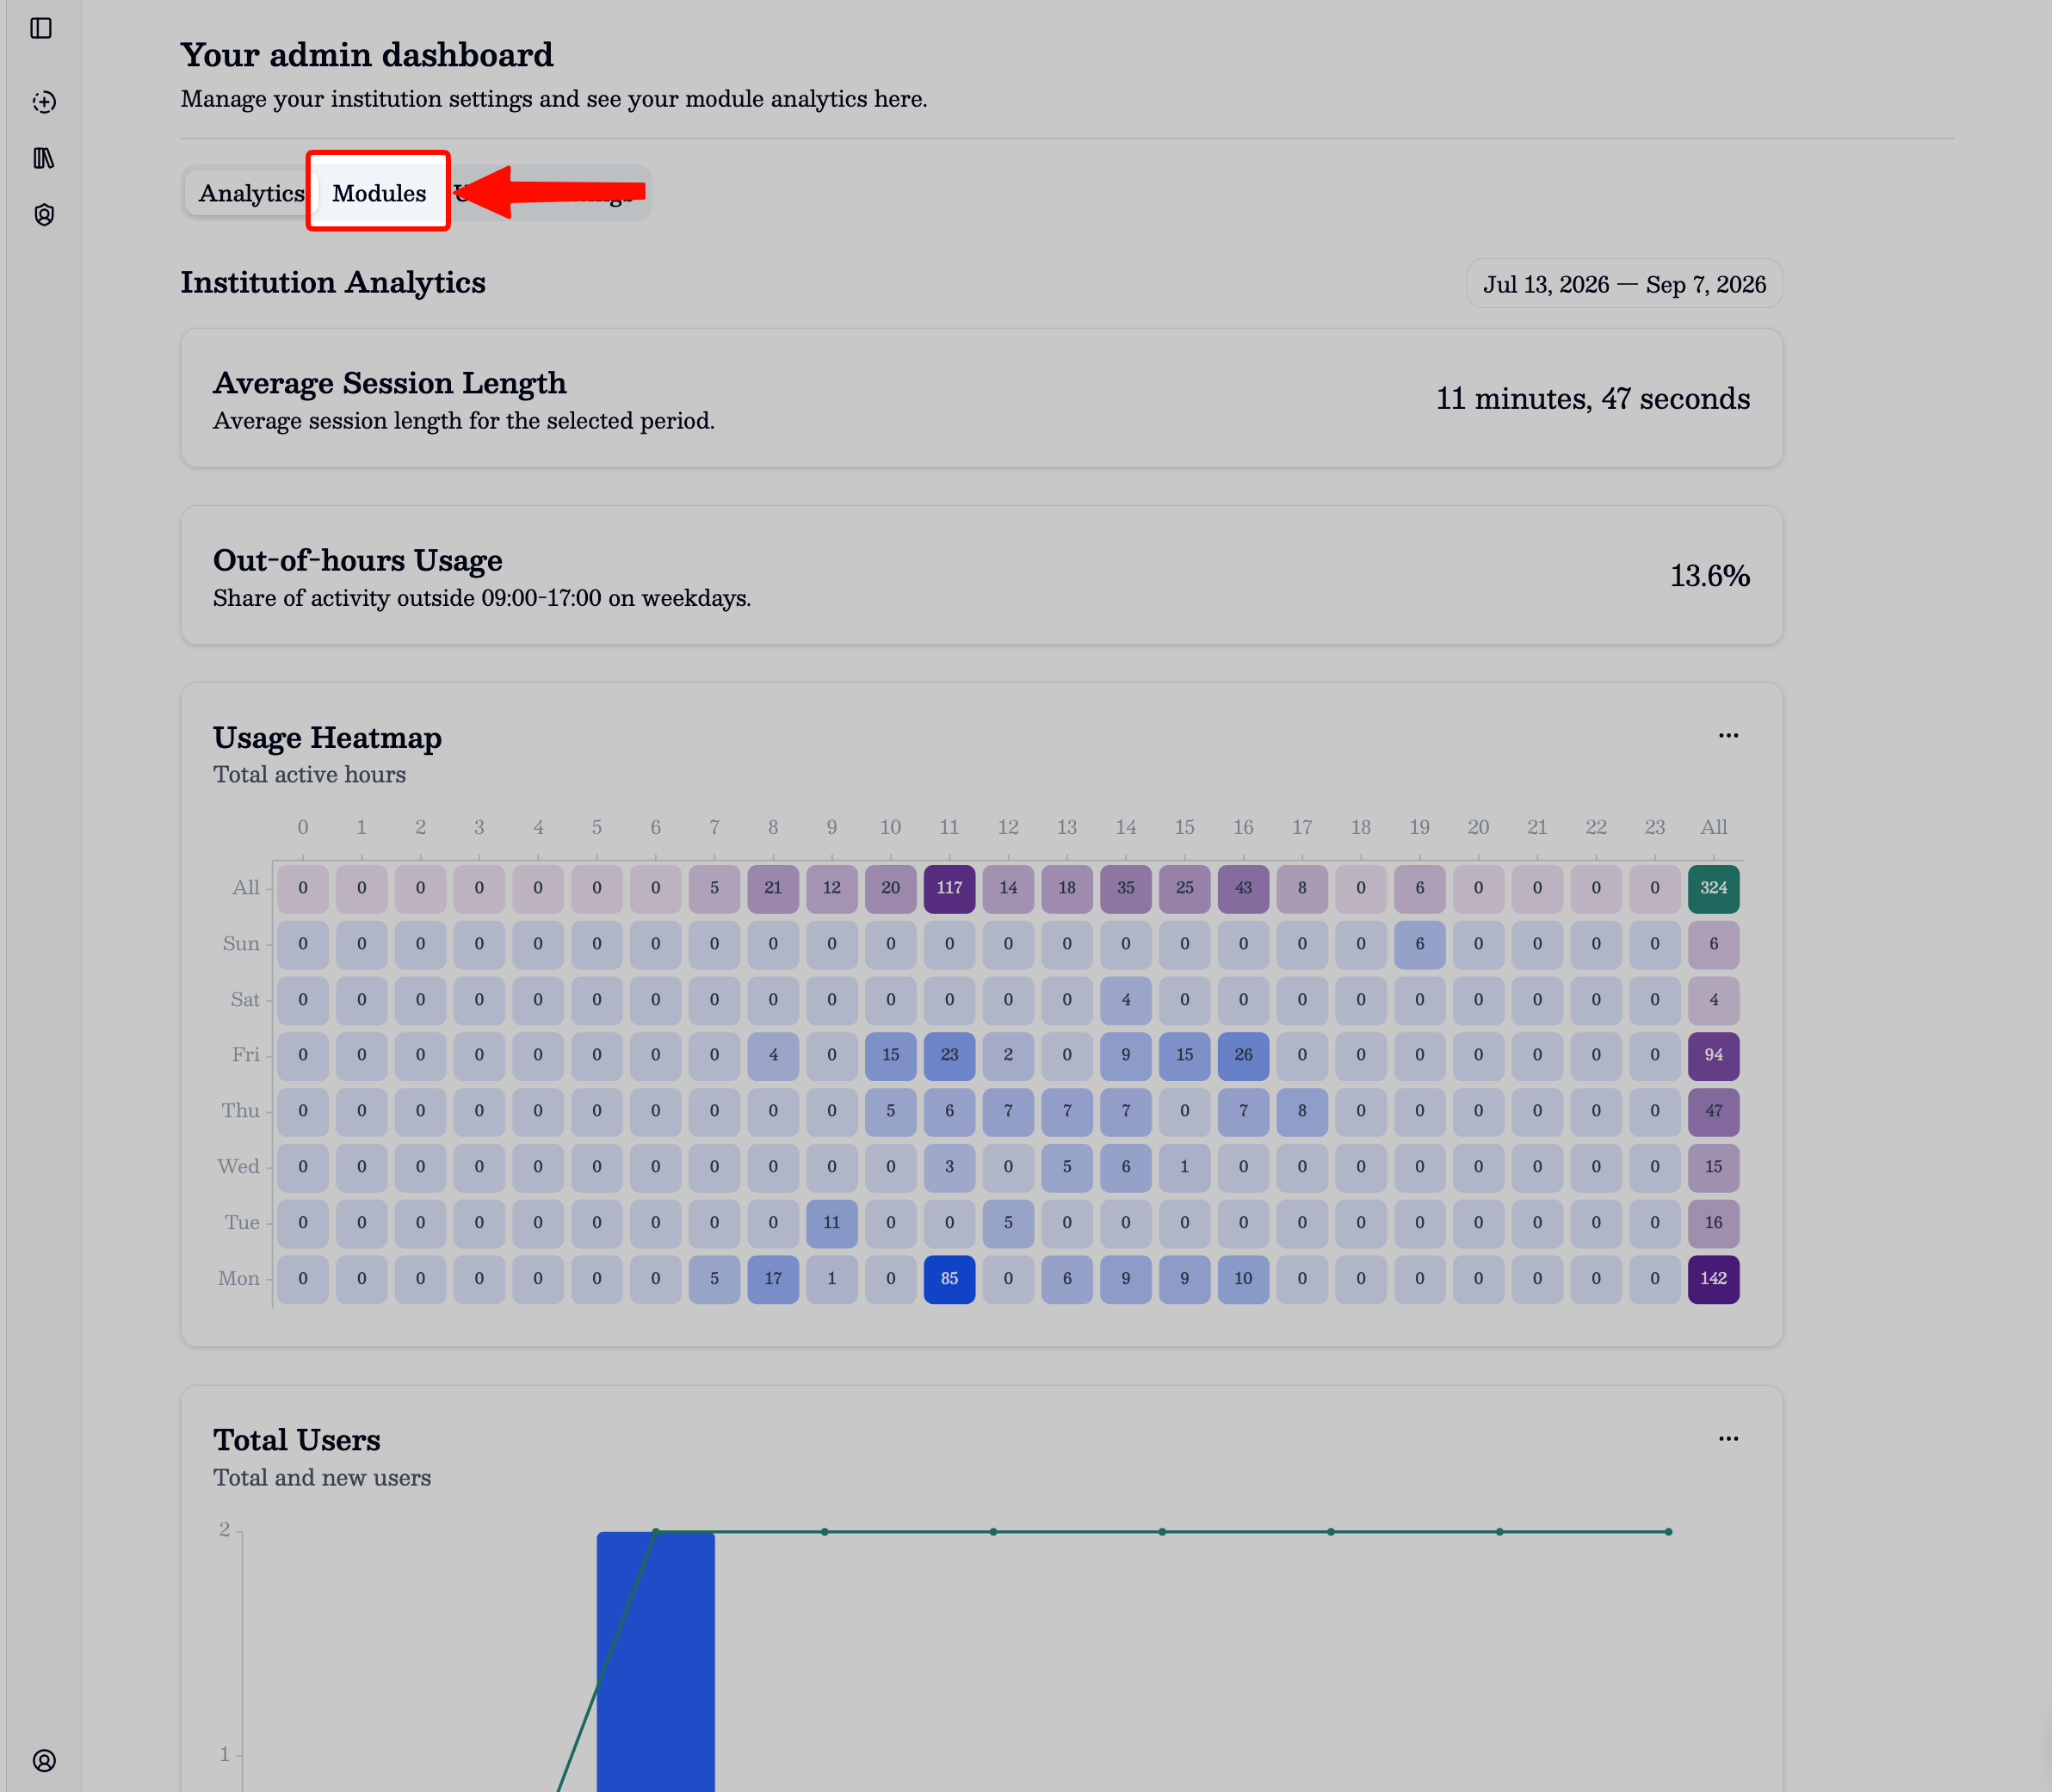
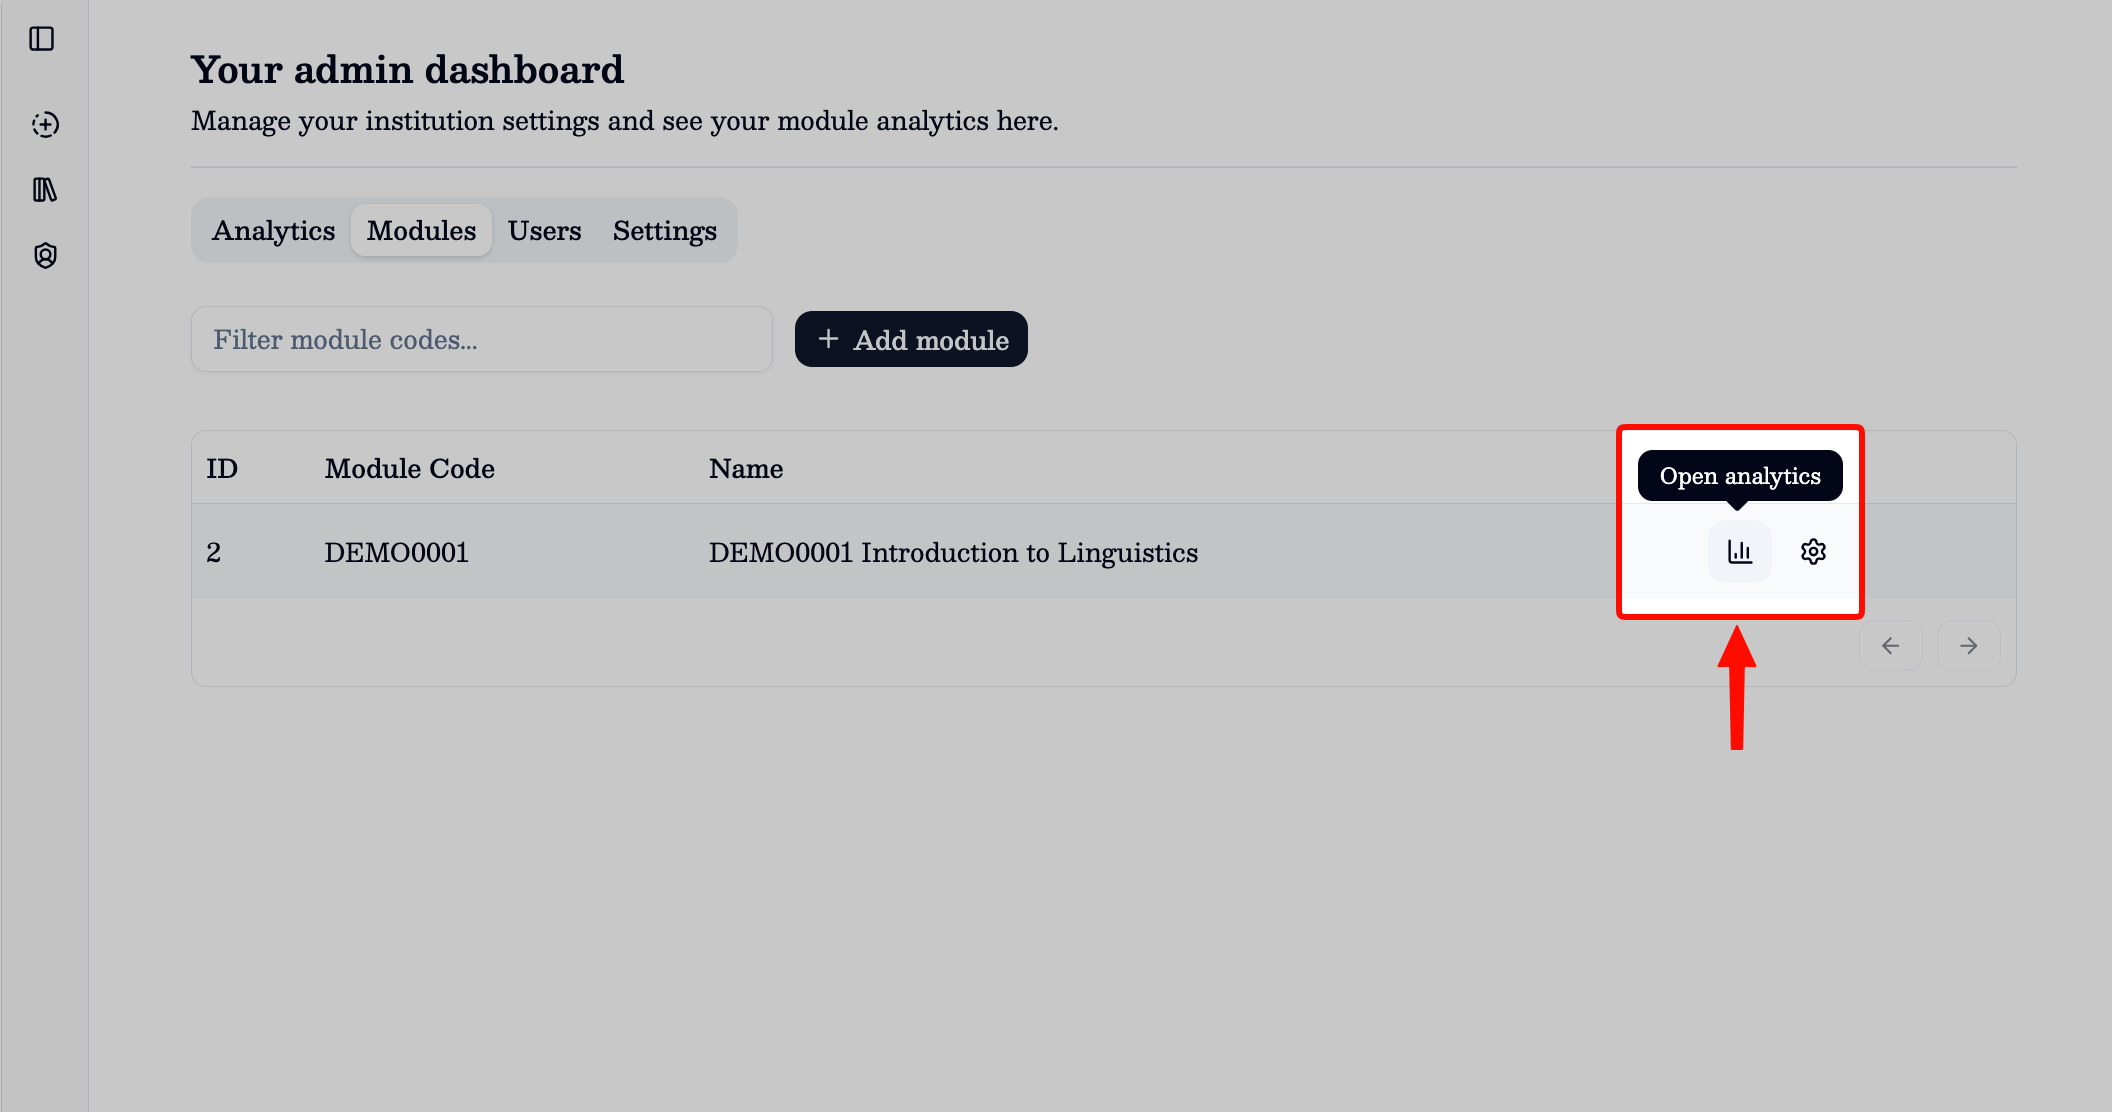
When logging in you will be presented with the admin dashboard homepage. Clicking the "Modules" tab at the top of the screen will show you the modules which you are able to access analytics and settings for.
Analytics overview
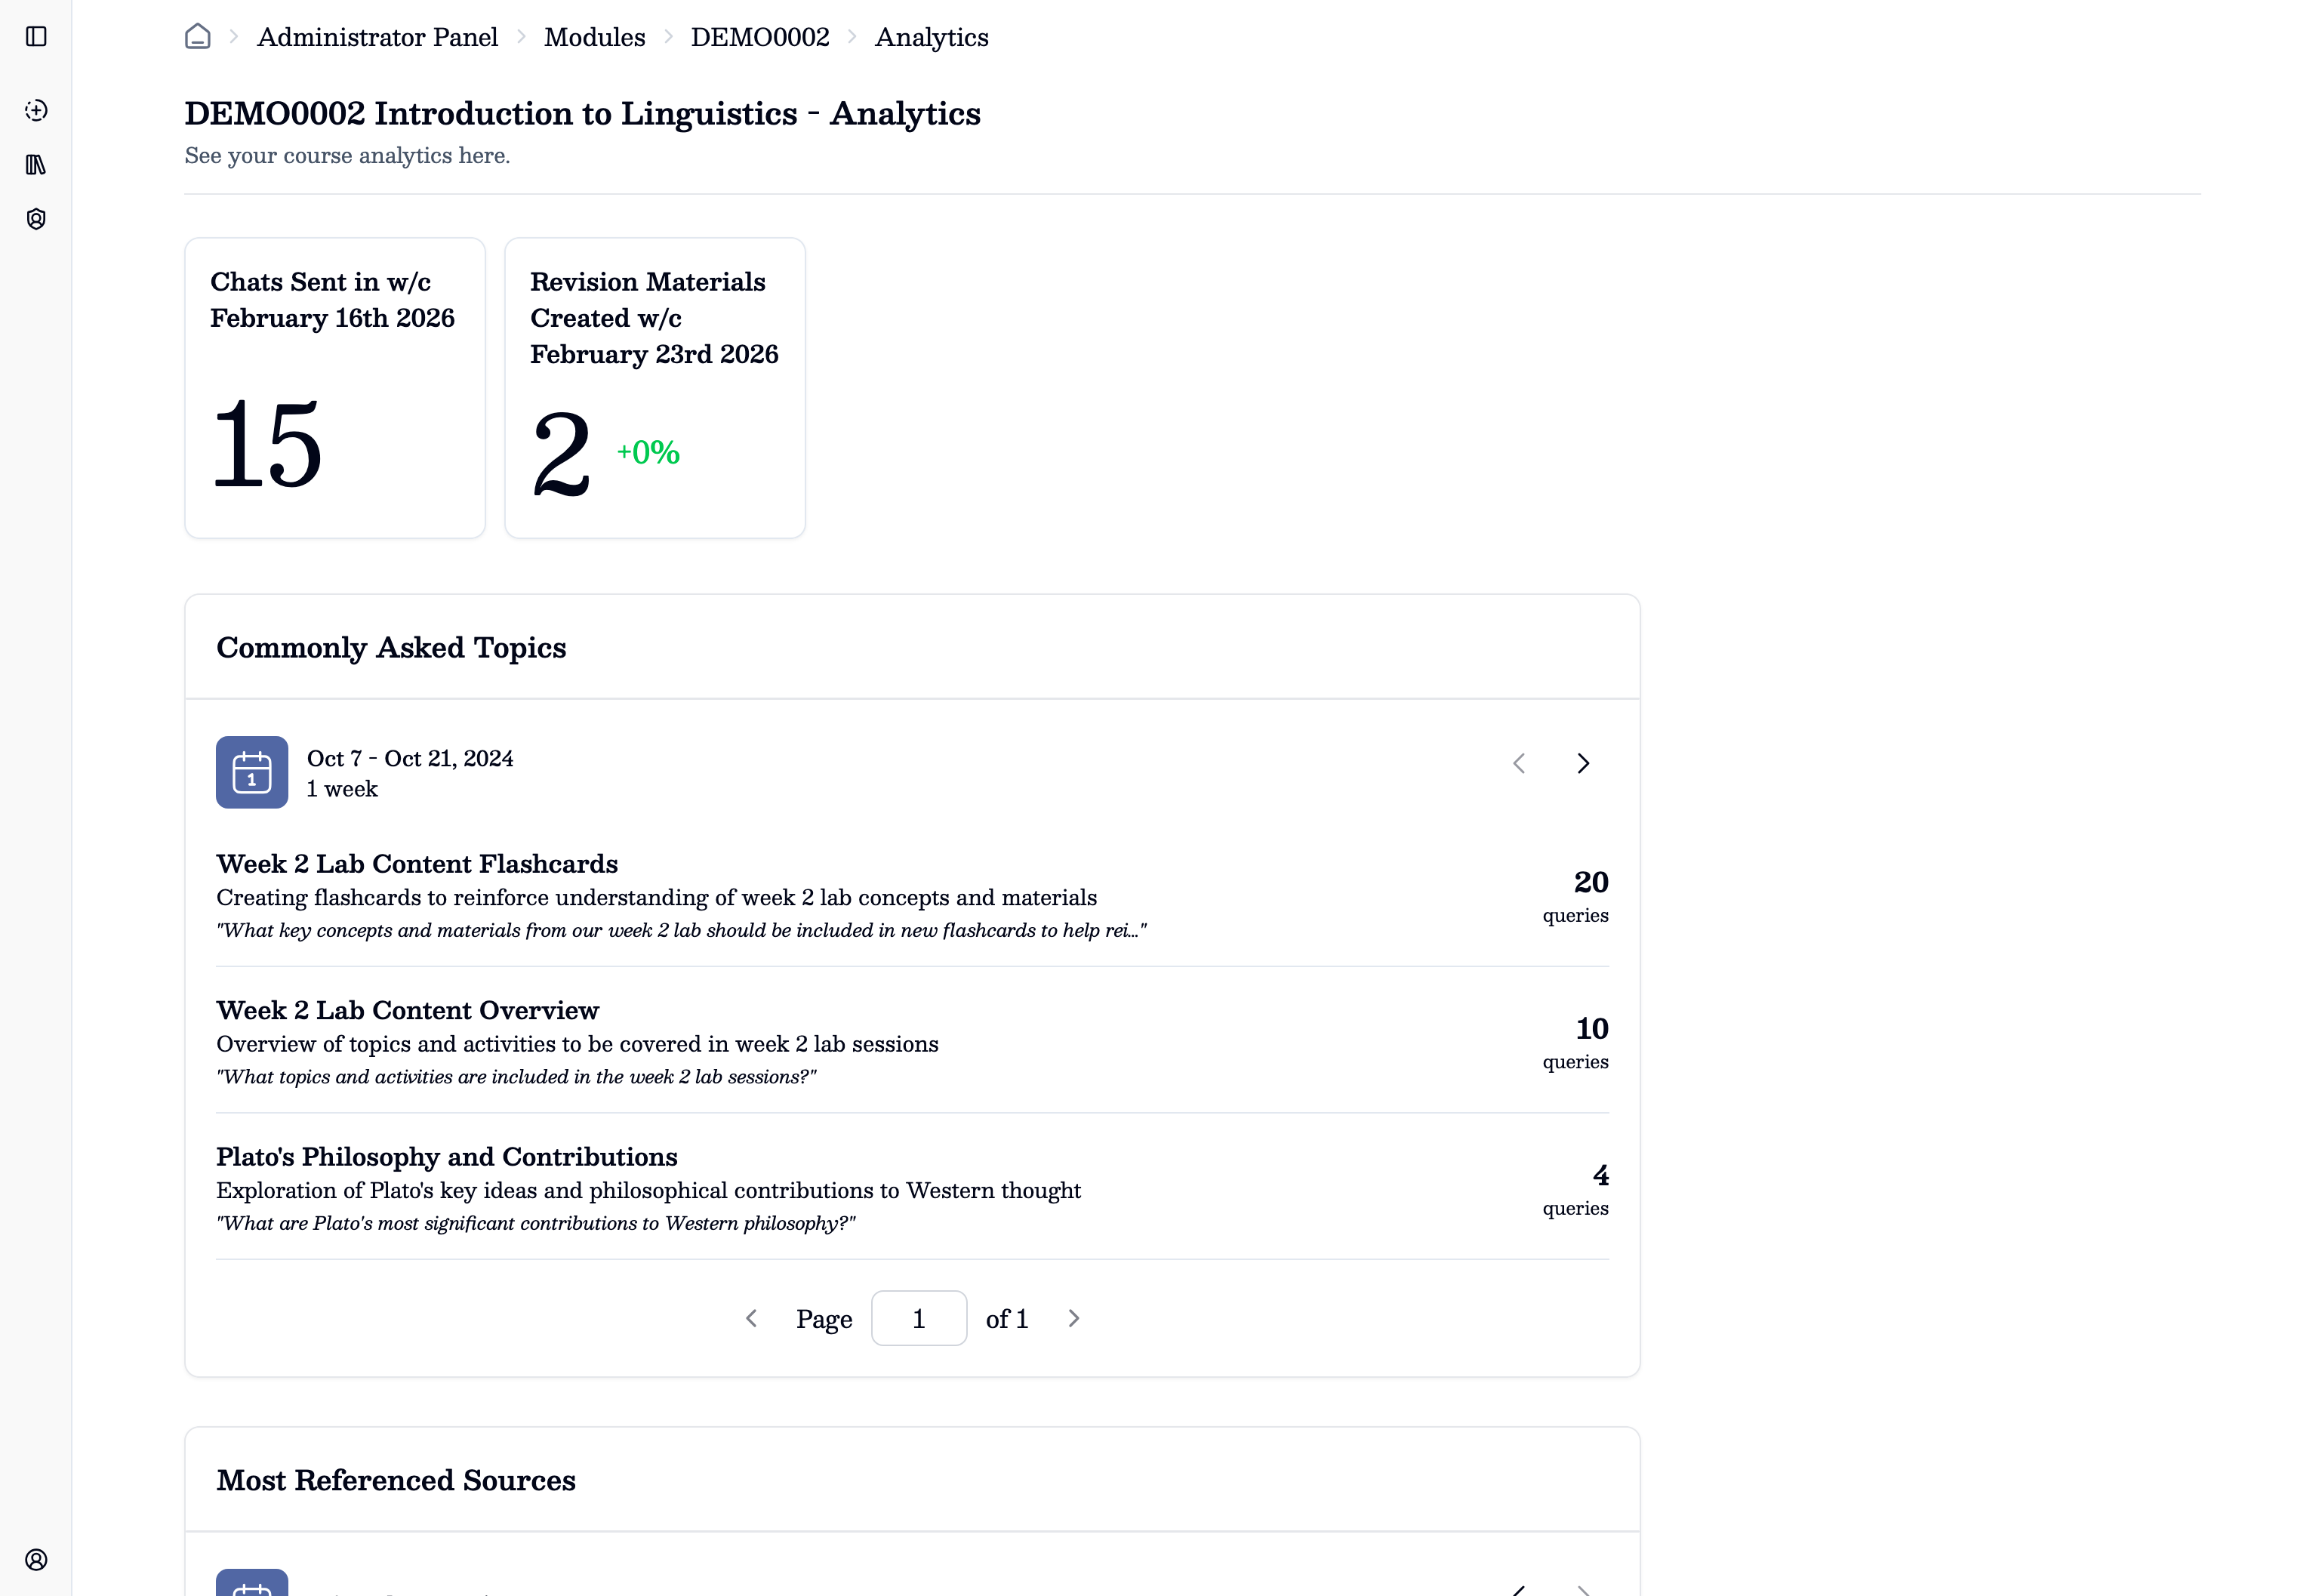
Plato showcases cohort-level analytics on your module. It does not show individual student analytics or chat logs. We believe analytics are most useful when treated as a prompt for teaching action rather than a complete picture of student cohort understanding.
FAQs
On the analytics page you are able to see weekly freequently asked questions allowing you to quickly identify any emerging patterns or topics that need attention. They can be used to identify concepts that need clearer explanation, notice patterns before an assessment point, spot repeated confusion across a cohort, or review whether certain materials may need improvement or clarification.
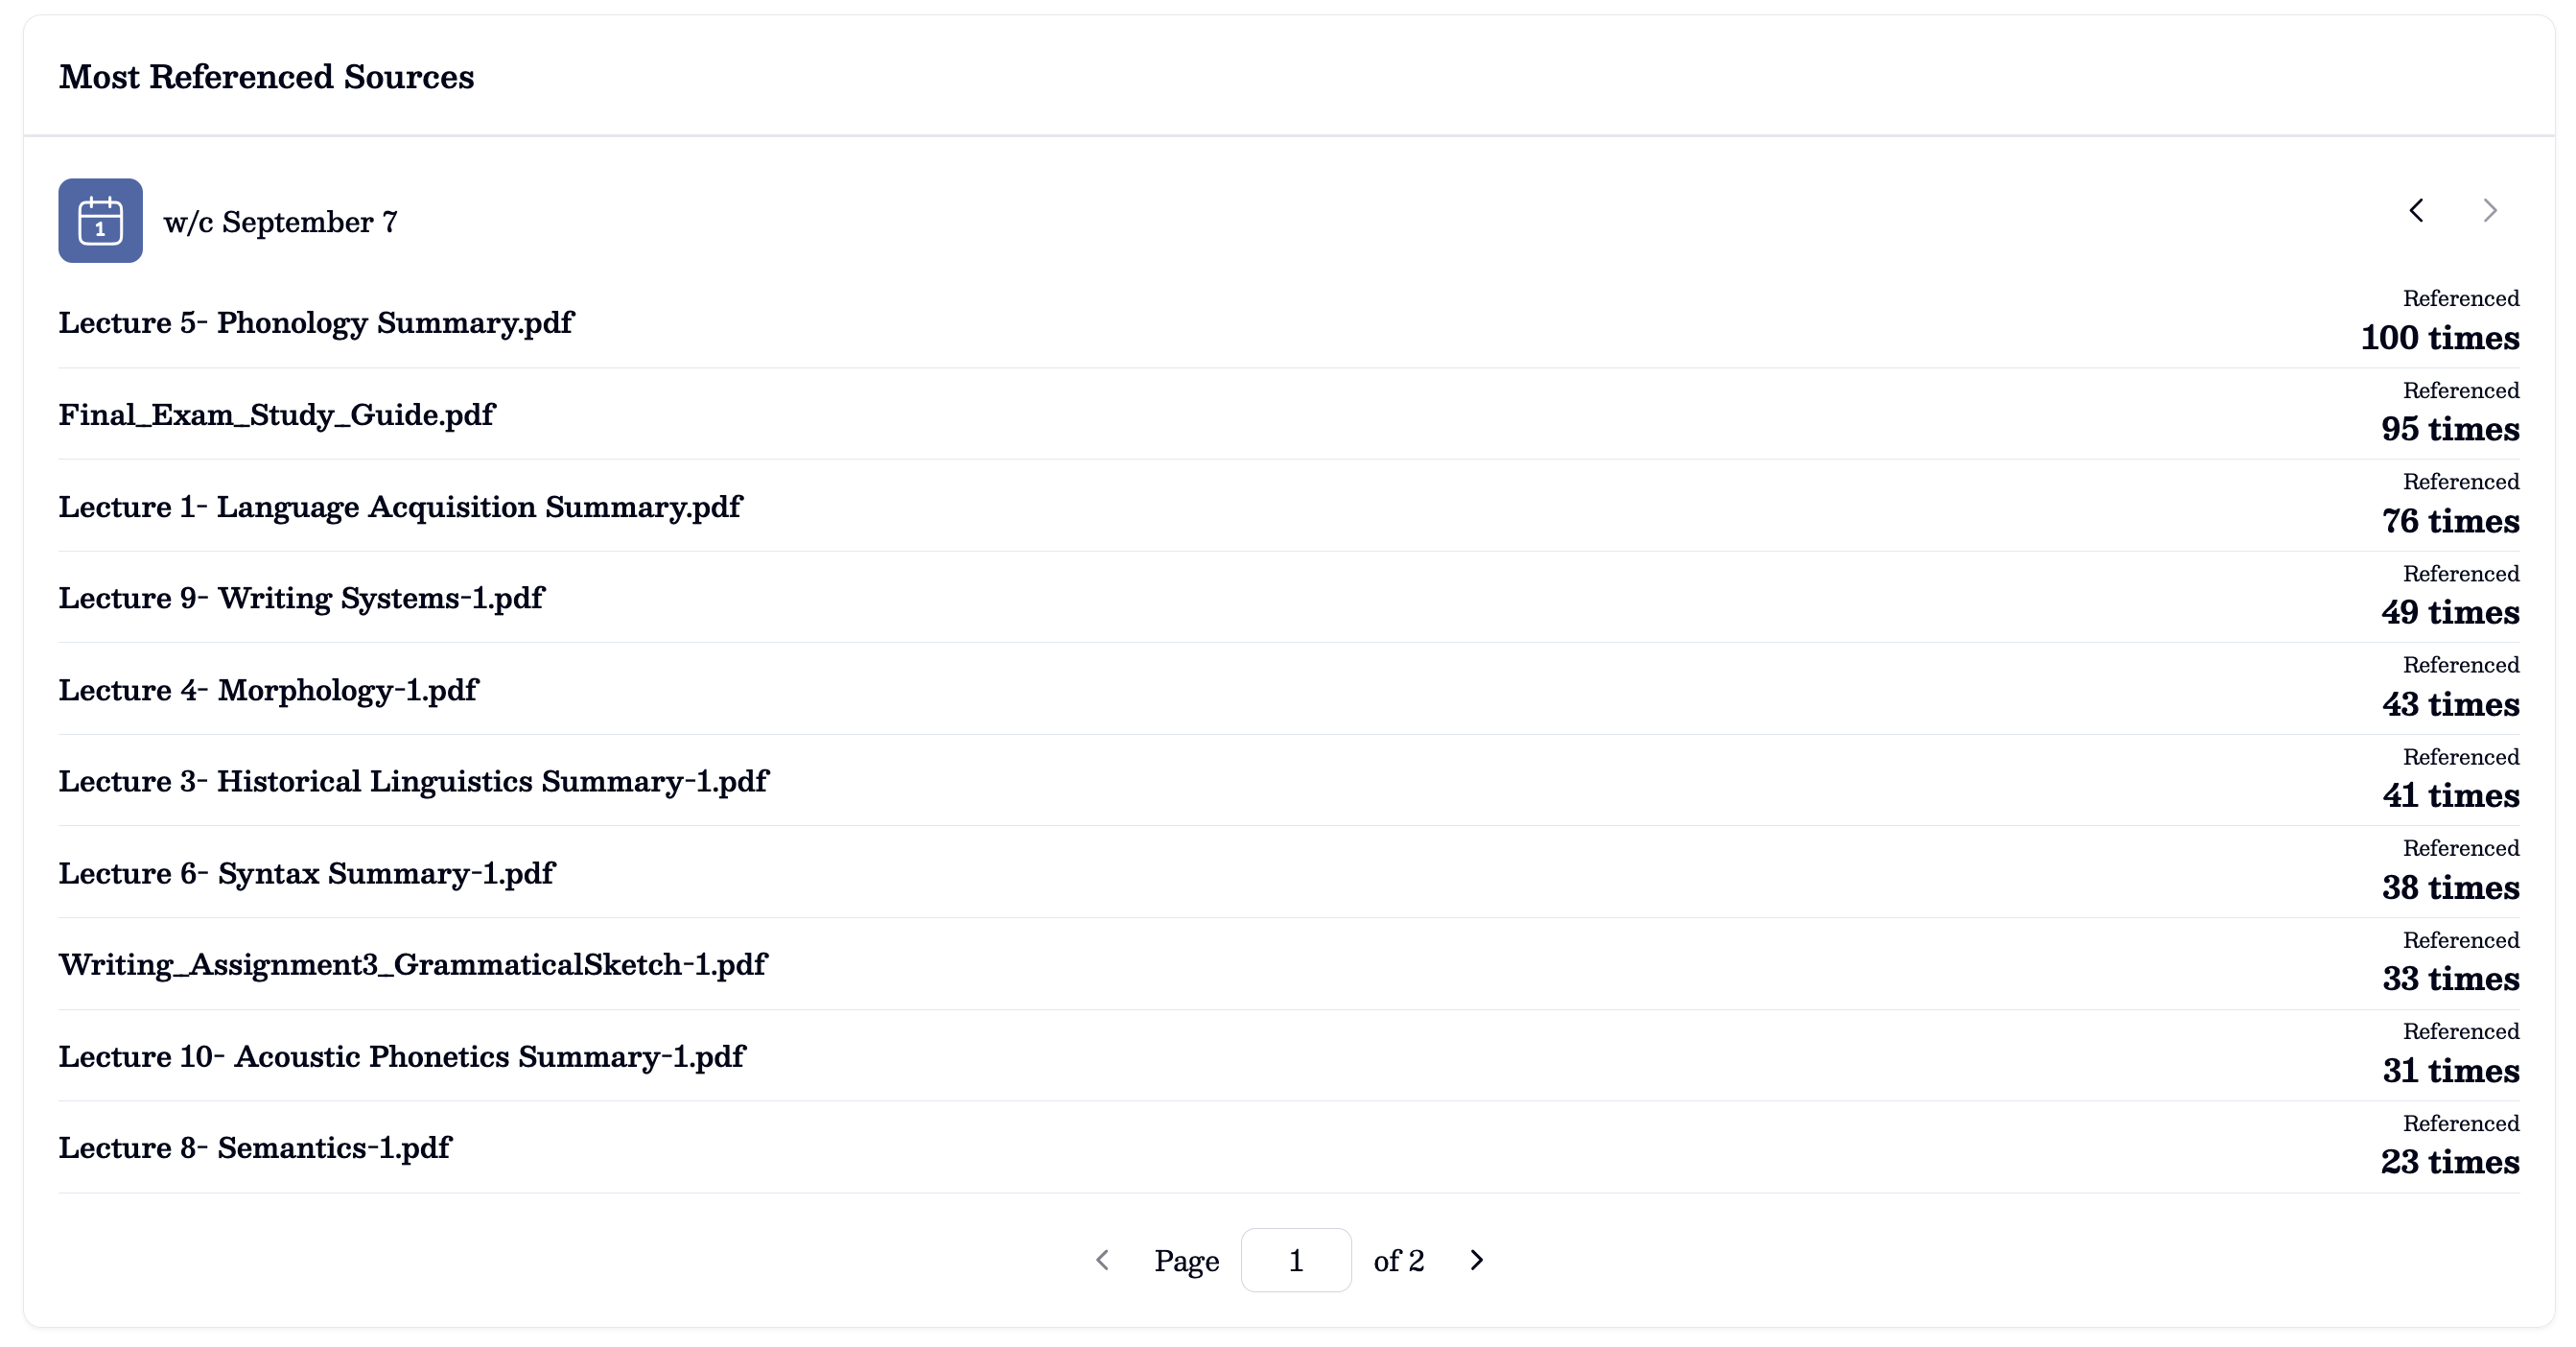
Common sources
Information on which content was most referenced by Plato is also available, highlighting which resources are used in Plato's answers the most.
Bloom's taxonomy & usage
Plato also shows the usage distributed by Bloom's taxonomy. Each student question is classified into one of the taxonomy's levels — Remember, Understand, Apply, Analyse, Evaluate, Create — so you can see how your cohort is engaging with the material, not just how often.